You’re on a journey to understanding the nuances of financial metrics, and today, we’re delving into ROIC, or Return on Invested Capital. What is it, you ask?
In simple terms, it’s a measure of how effectively a company uses the money it receives from its investors. But there’s more to it than that.
Over the next few paragraphs, we’ll unravel the essence of ROIC, exploring its significance and implications for investors seeking to maximise returns and mitigate risks in their investment endeavours.
It’s time to step up your investment game and comprehend how ROIC can significantly influence your financial decisions.
Ready to dive in? Let’s get started.

What is ROIC?
Let’s first find out the ROIC meaning. ROIC, or Return on Invested Capital (ROIC full form), is a performance ratio used to gauge the percentage return a company achieves on its invested capital.
By evaluating how efficiently a company utilises investors’ funds to generate income, ROIC provides crucial insights into its profitability.
As a benchmarking tool, this ratio aids in assessing the value of other companies, making it a vital metric for investors seeking to make informed decisions in the financial landscape.
ROIC Formula
Return on Invested Capital (ROIC) is a vital financial metric that gauges the efficiency of investment by considering both its cost and generated returns.
Earnings post-taxes but before interest payments constitute returns, while the investment’s value is derived from deducting current long-term liabilities from the company’s assets.
The cost of an investment may encompass total assets or financing from creditors/shareholders.
By dividing the returns by the cost of investment, ROIC provides investors with valuable insights into a company’s ability to generate profitable returns from its capital.
Given below is the formula of ROIC:
ROIC = (Net Operating Profit After Taxes – Adjusted Taxes) / (Total Invested Capital)
Where:
- Net Operating Profit After Taxes (NOPAT) is the company’s operating profit after deducting taxes.
- Adjusted Taxes are the taxes on operating profit, and it is calculated as Tax Rate * NOPAT.
- Total Invested Capital represents the total capital invested in the company, including both debt and equity. It is calculated as Total Debt + Total Equity.
ROIC is expressed as a percentage and is a key measure of a company’s efficiency in utilising its invested capital to generate profits. A higher ROIC indicates better capital efficiency and better returns for investors.
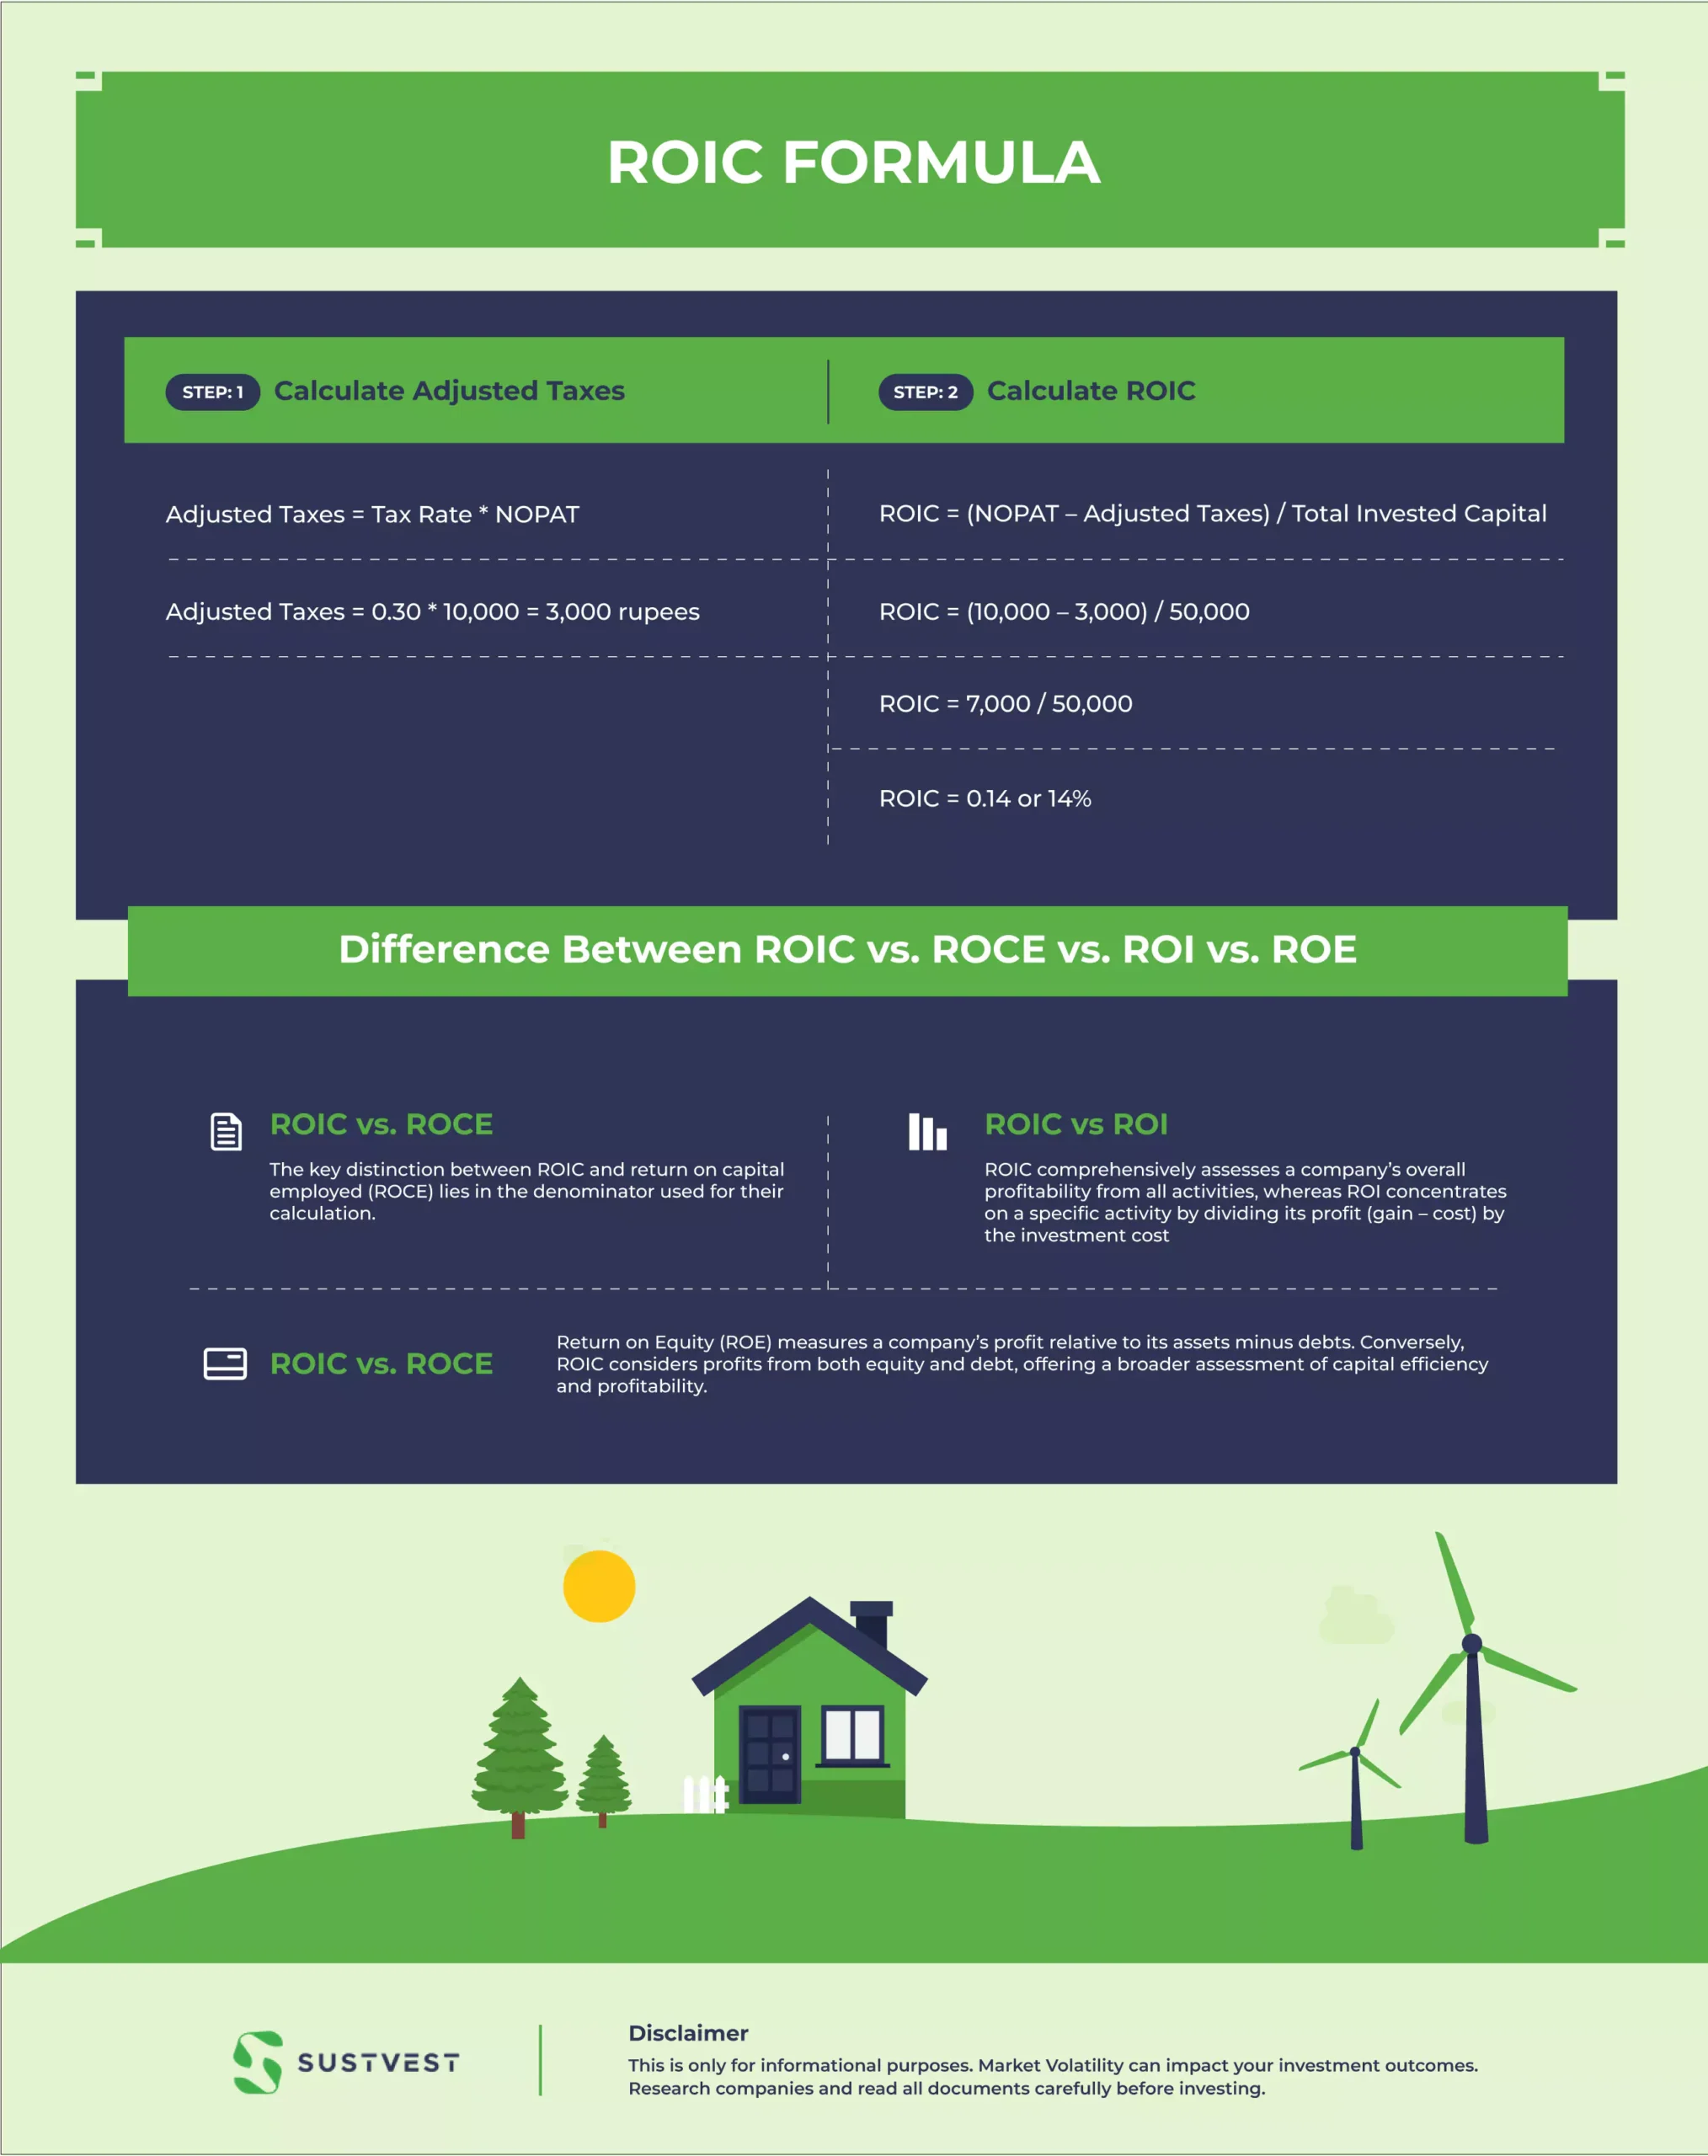
Now, Let’s consider a hypothetical company with a Net Operating Profit After Taxes (NOPAT) of 10,000 rupees and a Total Invested Capital of 50,000 rupees. The tax rate is 30%.
Step 1: Calculate Adjusted Taxes
Adjusted Taxes = Tax Rate * NOPAT
Adjusted Taxes = 0.30 * 10,000 = 3,000 rupees
Step 2: Calculate ROIC
ROIC = (NOPAT – Adjusted Taxes) / Total Invested Capital
= (10,000 – 3,000) / 50,000
= 7,000 / 50,000
0.14 or 14%
In this example, the company’s ROIC is 14%, indicating that for every rupee invested in the company, it generates a return of 14 paise in profit.
Difference Between ROIC vs. ROCE vs. ROI vs. ROE
ROIC differs from ROCE, ROI, and ROE despite their similar names. considers all invested capital (debt and equity), while others focus on specific capital components, making it a more comprehensive metric for assessing overall capital efficiency.
ROIC vs. ROCE
The key distinction between ROIC and return on capital employed (ROCE) lies in the denominator used for their calculation.
ROIC utilises invested capital, a subset of capital employed, while ROCE considers the broader capital employed. Additionally, ROCE typically employs after-tax book values, while ROIC often relies on pre-tax amounts.
These differences influence how both metrics assess a company’s efficiency in generating profits from its capital investments.
ROIC vs ROI
ROIC comprehensively assesses a company’s overall profitability from all activities, whereas ROI concentrates on a specific activity by dividing its profit (gain – cost) by the investment cost.
Additionally, ROIC is usually calculated over 12 months, while ROI lacks a standard time period for its calculations.
These distinctions highlight how each metric offers unique perspectives on a company’s financial performance and investment outcomes.
When deciphering financial jargon, understanding Return On Investment vs. Return On Assets (ROI vs. ROA) is crucial. Both provide insights into a company’s performance but from different perspectives.
ROIC vs. ROE
Return on Equity (ROE) measures a company’s profit relative to its assets minus debts. Conversely, ROIC considers profits from both equity and debt, offering a broader assessment of capital efficiency and profitability.
What is a Good ROIC?
A strong ROIC surpassing the company’s weighted average cost of capital (WACC) by at least 2% indicates efficient capital utilisation and profitable operations.
This means the management team can generate profits from investor and debtholder resources.
It signals that excess returns should be reinvested in the company to fuel future growth, satisfying investor expectations for prudent capital allocation and maximising returns on their investments.
However, if you have a bad ROIC, it can be enriched by expanding its formula to incorporate company sales, enabling a comprehensive evaluation of a company’s competitiveness
ROIC = Net Operating Profit After Taxes (NOPAT) / Invested Capital
ROIC = NOPATSALES SALESIC
Each ratio in the Return on Invested Capital (ROIC) framework reflects a distinct aspect of a company’s competitiveness.
The NOPAT / Sales ratio signifies the profit margin, while the Sales / IC ratio measures capital efficiency. By analysing ROIC’s components, companies gain insights into their performance drivers.
Continuously monitoring the profit margin and capital efficiency ratios over multiple quarters reveals how operational changes impact ROIC.
This ongoing evaluation empowers companies to optimise operations and use their capital more effectively, driving improved financial performance and bolstering their competitive position in the market.
As you navigate the investment world, it’s essential to Know The Benefits of Investing in Startups and the Potential Market to Invest on. Startups can offer high rewards alongside risks.
Limitations of ROIC
While ROIC is a valuable metric for assessing a company’s capital efficiency and profitability, it does have limitations. ROIC alone does not reveal which specific business segments are generating value, nor does it account for non-recurring events that can distort results when based on net income.
However, ROIC plays a vital role in providing context for other metrics, such as the price-to-earnings (P/E) ratio. It helps investors interpret the P/E ratio more accurately.
A declining ROIC might explain a seemingly oversold P/E ratio, indicating the company’s declining ability to create shareholder value.
Conversely, companies with consistently high ROIC are likely to command premium valuations, justifying potentially higher P/E ratios due to their consistent track record of generating robust returns on invested capital.
Case Study of Walmart
In fiscal year 2022, Walmart’s ROIC was approximately 11.8%. For Walmart, the ROIC calculation involves determining its net operating profit after taxes (NOPAT)
NOPAT is found by taking the operating income of $25.942 billion and applying the effective tax rate of 25.44%. This results in a NOPAT of $19.342 billion.
To calculate the invested capital, we subtract the current liabilities (accounts payable, accrued liabilities, and accrued taxes) of $82.172 billion from the total assets of $244.86 billion.
This leaves Walmart with an invested capital of $162.688 billion at the end of fiscal 2022. By performing the same calculation for the beginning of the year. the average invested capital over the year comes out to be around $163.918 billion.
Hence, Walmart’s ROIC of 11.8% signifies that for every rupee of invested capital, the company generated a return of approximately 11.8%. This indicates a moderate level of efficiency in using its capital to generate profits during fiscal 2022.
FAQs
How is ROIC different from other profitability ratios?
Unlike traditional metrics like Return on Equity (ROE), ROIC considers both debt and equity in its calculation, offering a more comprehensive view of a company’s profitability.
What Does Return on Invested Capital Tell You?
ROIC helps investors identify companies that efficiently utilize their invested capital, indicating better potential for sustainable growth and higher returns.
What does a high ROIC indicate?
A high ROIC suggests that a company is generating substantial profits from its invested capital, demonstrating effective operational management and superior performance.
Can ROIC be used to compare companies from different industries?
Yes, ROIC is a valuable tool for cross-industry comparisons as it focuses on capital efficiency, making it a more standardised metric for evaluating business performance.
How to calculate return on invested capital?
Return on Invested Capital (ROIC) is calculated using the formula:
ROIC= NOPAT /Total Invested Capital
Where NOPAT is Net Operating Profit After Taxes, calculated as Operating Income * (1 – Tax Rate),
Conclusion
ROIC (Return on Invested Capital) serves as a crucial financial metric for evaluating a company’s efficiency
It provides valuable insights into the effectiveness of a firm’s operational management and capital allocation strategies.
As investors seek sustainable investment opportunities, ROIC becomes even more pertinent in assessing companies’ long-term viability and potential.
In the current era of sustainable development, let’s explore the Best Green Investment Opportunities Available in India. Eco-conscious investing can be profitable and responsible.
With a strong emphasis on sustainability, SustVest can leverage ROIC as a key performance indicator to make informed investment decisions. ensuring a greener and more responsible portfolio.

Founder of Sustvest
Hardik completed his B.Tech from BITS Pilani. Keeping the current global scenario, the growth of renewable energy in mind, and people looking for investment opportunities in mind he founded SustVest ( formerly, Solar Grid X ) in 2018. This venture led him to achieve the ‘Emerging Fintech Talent of the Year in MENA region ‘ in October 2019.